Zendure Monitor

A tiny native macOS menu bar app showing the live solar production of a Zendure SolarFlow battery — local-first (no account, no broker, no credentials on your LAN), with an optional Zendure Cloud mode for when the local API isn't reachable.

⬇︎  Download for macOS View on GitHub

Free & open source (MIT) · macOS 14+ · signed & notarized DMG · Sparkle auto-updates · local-first

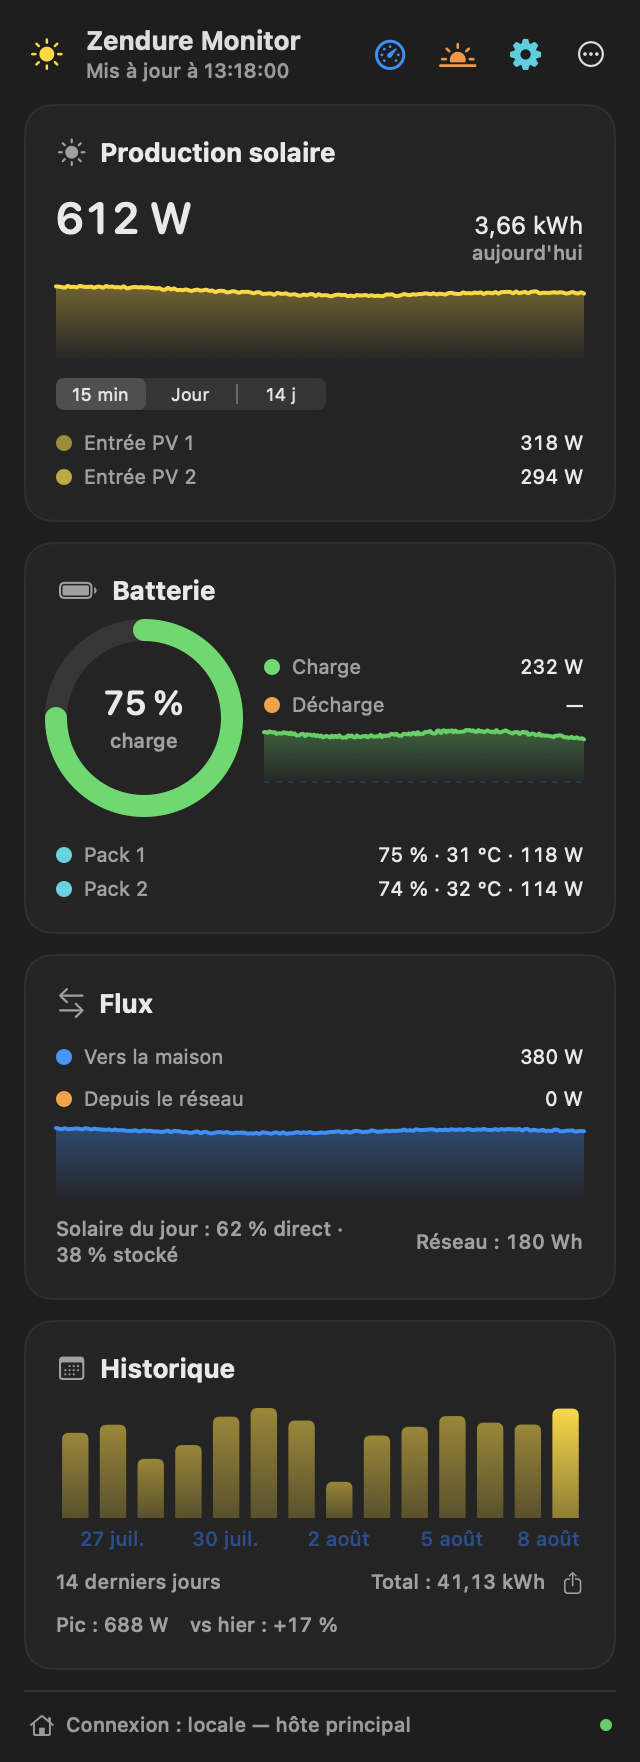
Zendure Monitor panel in dark theme: header with icon actions, solar production with a period selector, battery state of charge with a ring gauge, energy flows and 14-day history
Click the menu bar item for the full picture — production, state of charge, energy flows, history and stats.

Features

Everything the SolarFlow reports on your LAN, one click away — and a few things you can send back to it.

☀️ Live wattage in the menu bar

Your current solar production sits permanently in the menu bar, polled every 5 seconds. Prefer something else? Show the battery percentage, the power sent to the home — or just the icon.

📊 The full panel

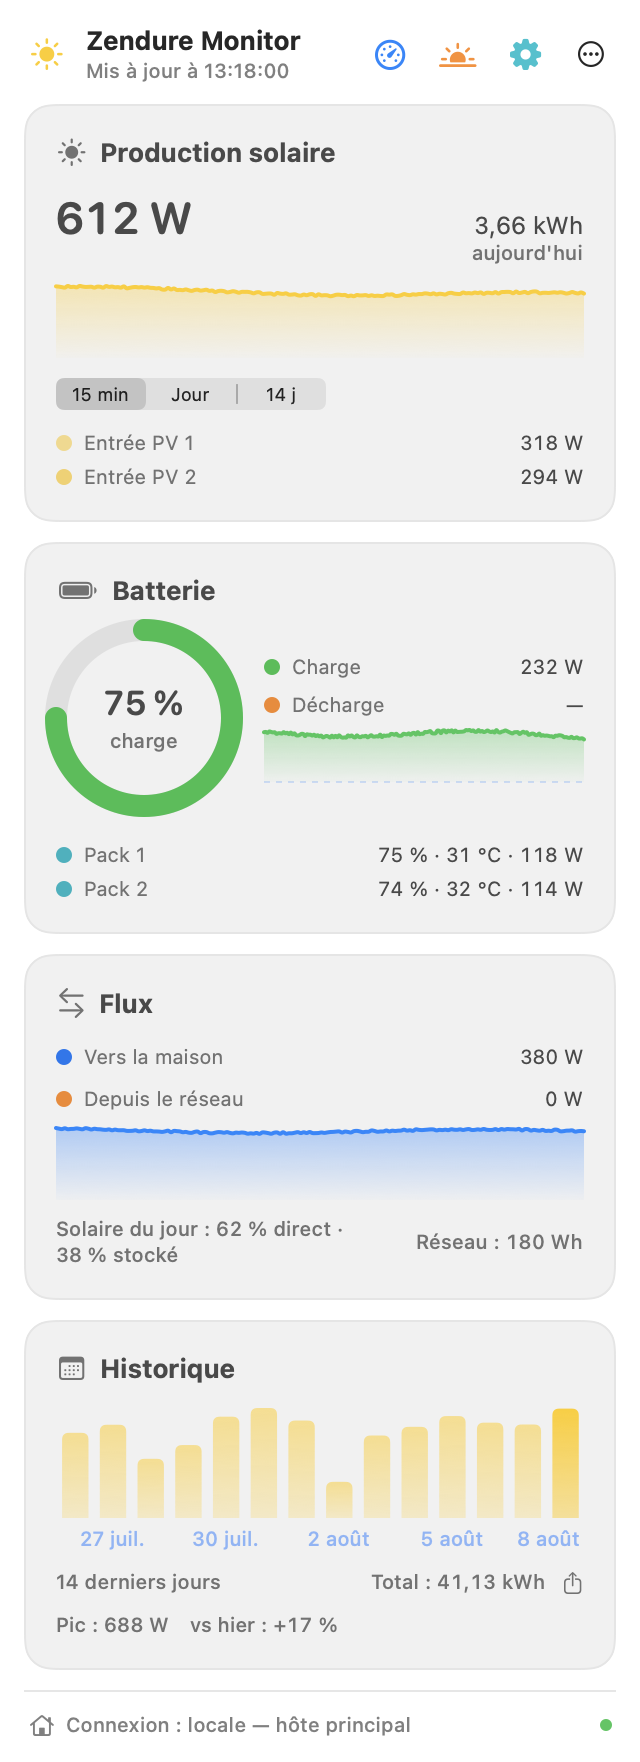
Battery state of charge, charge and discharge power, output to the home, grid input, per-MPPT PV input, today's solar energy, per-pack SOC and temperature, the home's total consumption — with a 15 min / day / 14 days selector, daily peak and a vs-yesterday comparison. New in 1.11: every card collapses to one line (click its header — the key value stays visible) and can be hidden entirely in Settings.

🔀 Energy flow — two readings

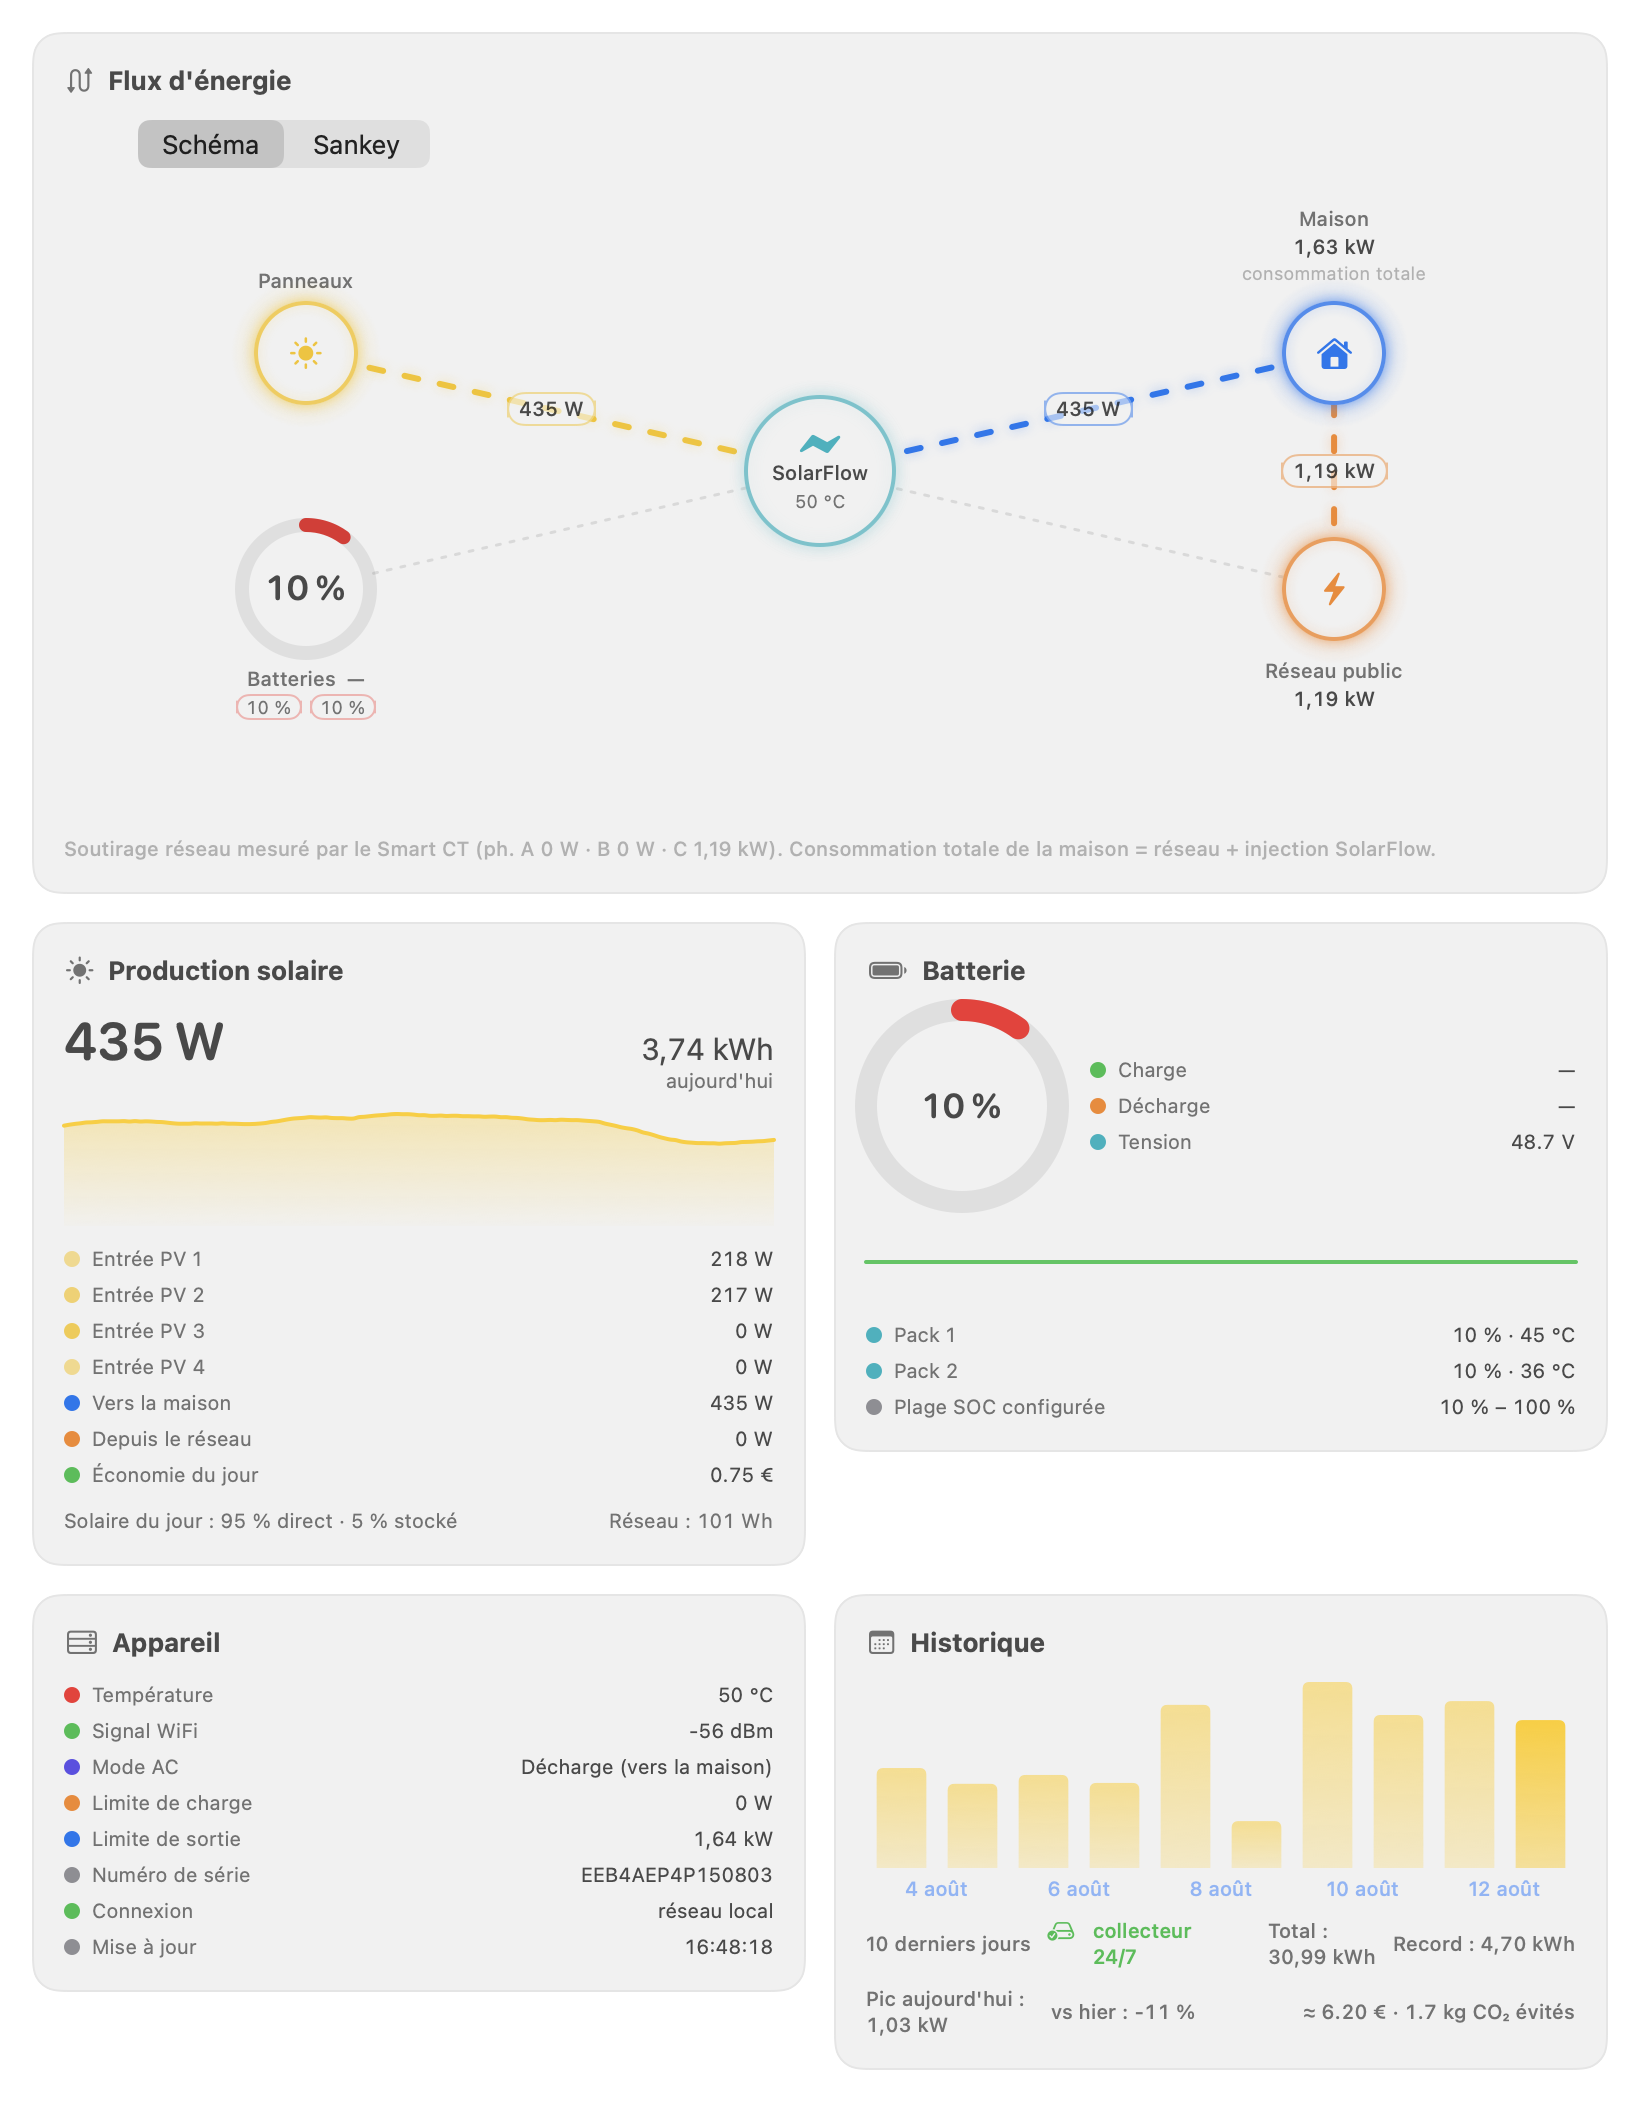
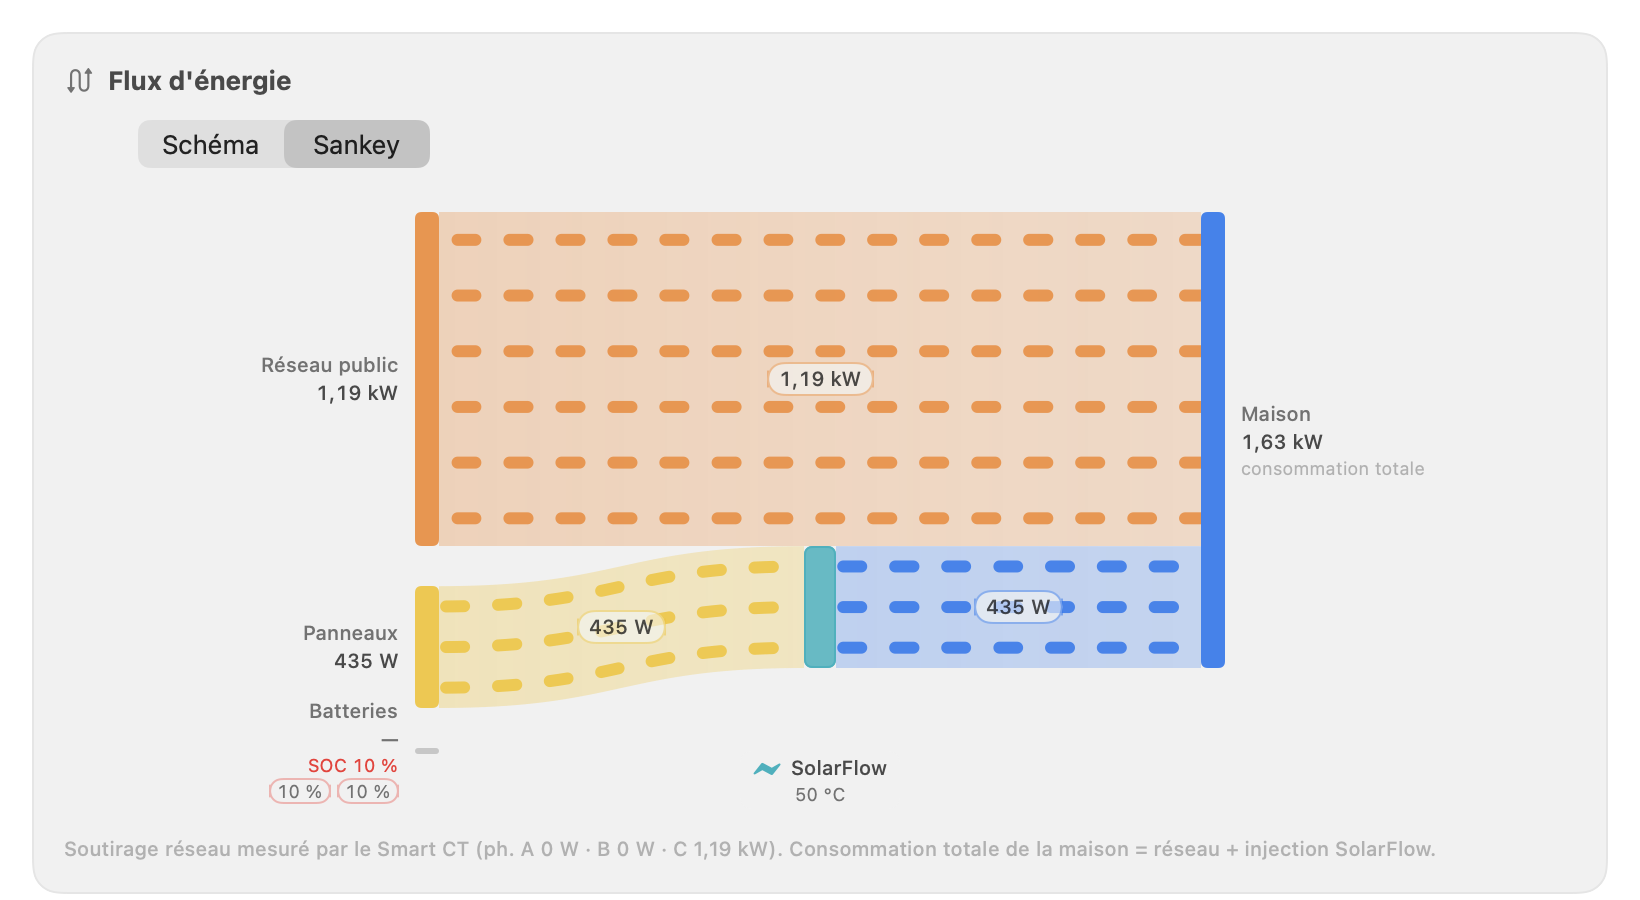
New in 2.2: the same flows, the same numbers, read two ways — a picker switches between them and remembers your choice. Schematic shows the topology: the SolarFlow at the center, panels, batteries with per-pack SOC chips, grid, home and the off-grid outlet around it, each link animating only when energy actually flows. Sankey makes ribbon width the wattage, so the split reads at a glance — and it shows what the schematic can't: how much of your consumption never goes through the battery at all. In both, the grid→home draw is explicit — measured with a Smart CT, honestly marked “not measured” without one — plus savings in € and CO₂.

☁️ Cloud mode & Smart CT

New in 1.10. Away from home or LAN down? Switch to the optional Zendure Cloud mode: paste the app's Authorization Cloud Key (kept in the macOS Keychain) and the data arrives in real time over MQTT — read-only, the local API stays the default. And if a SmartMeter3CT sits in your electrical panel, the app polls it on the LAN for the home's real grid draw and total consumption. New in 1.11: an opt-in automatic switch moves to Cloud when the battery stops answering locally, and back to local as soon as it does again.

🌅 Sun analytics — now inside SunRoad

Everything the Sun window pioneered lives on in SunRoad's sidebar: per-array azimuth/tilt sliders that re-aim the panels live in the 3D scene, ephemerides computed locally (NOAA — nothing leaves your Mac), twilights and golden hours, clear-sky theoretical output with estimated efficiency, and the local weather (Open-Meteo) with a cloud-adjusted forecast.

🧊 SunRoad — your home in 3D

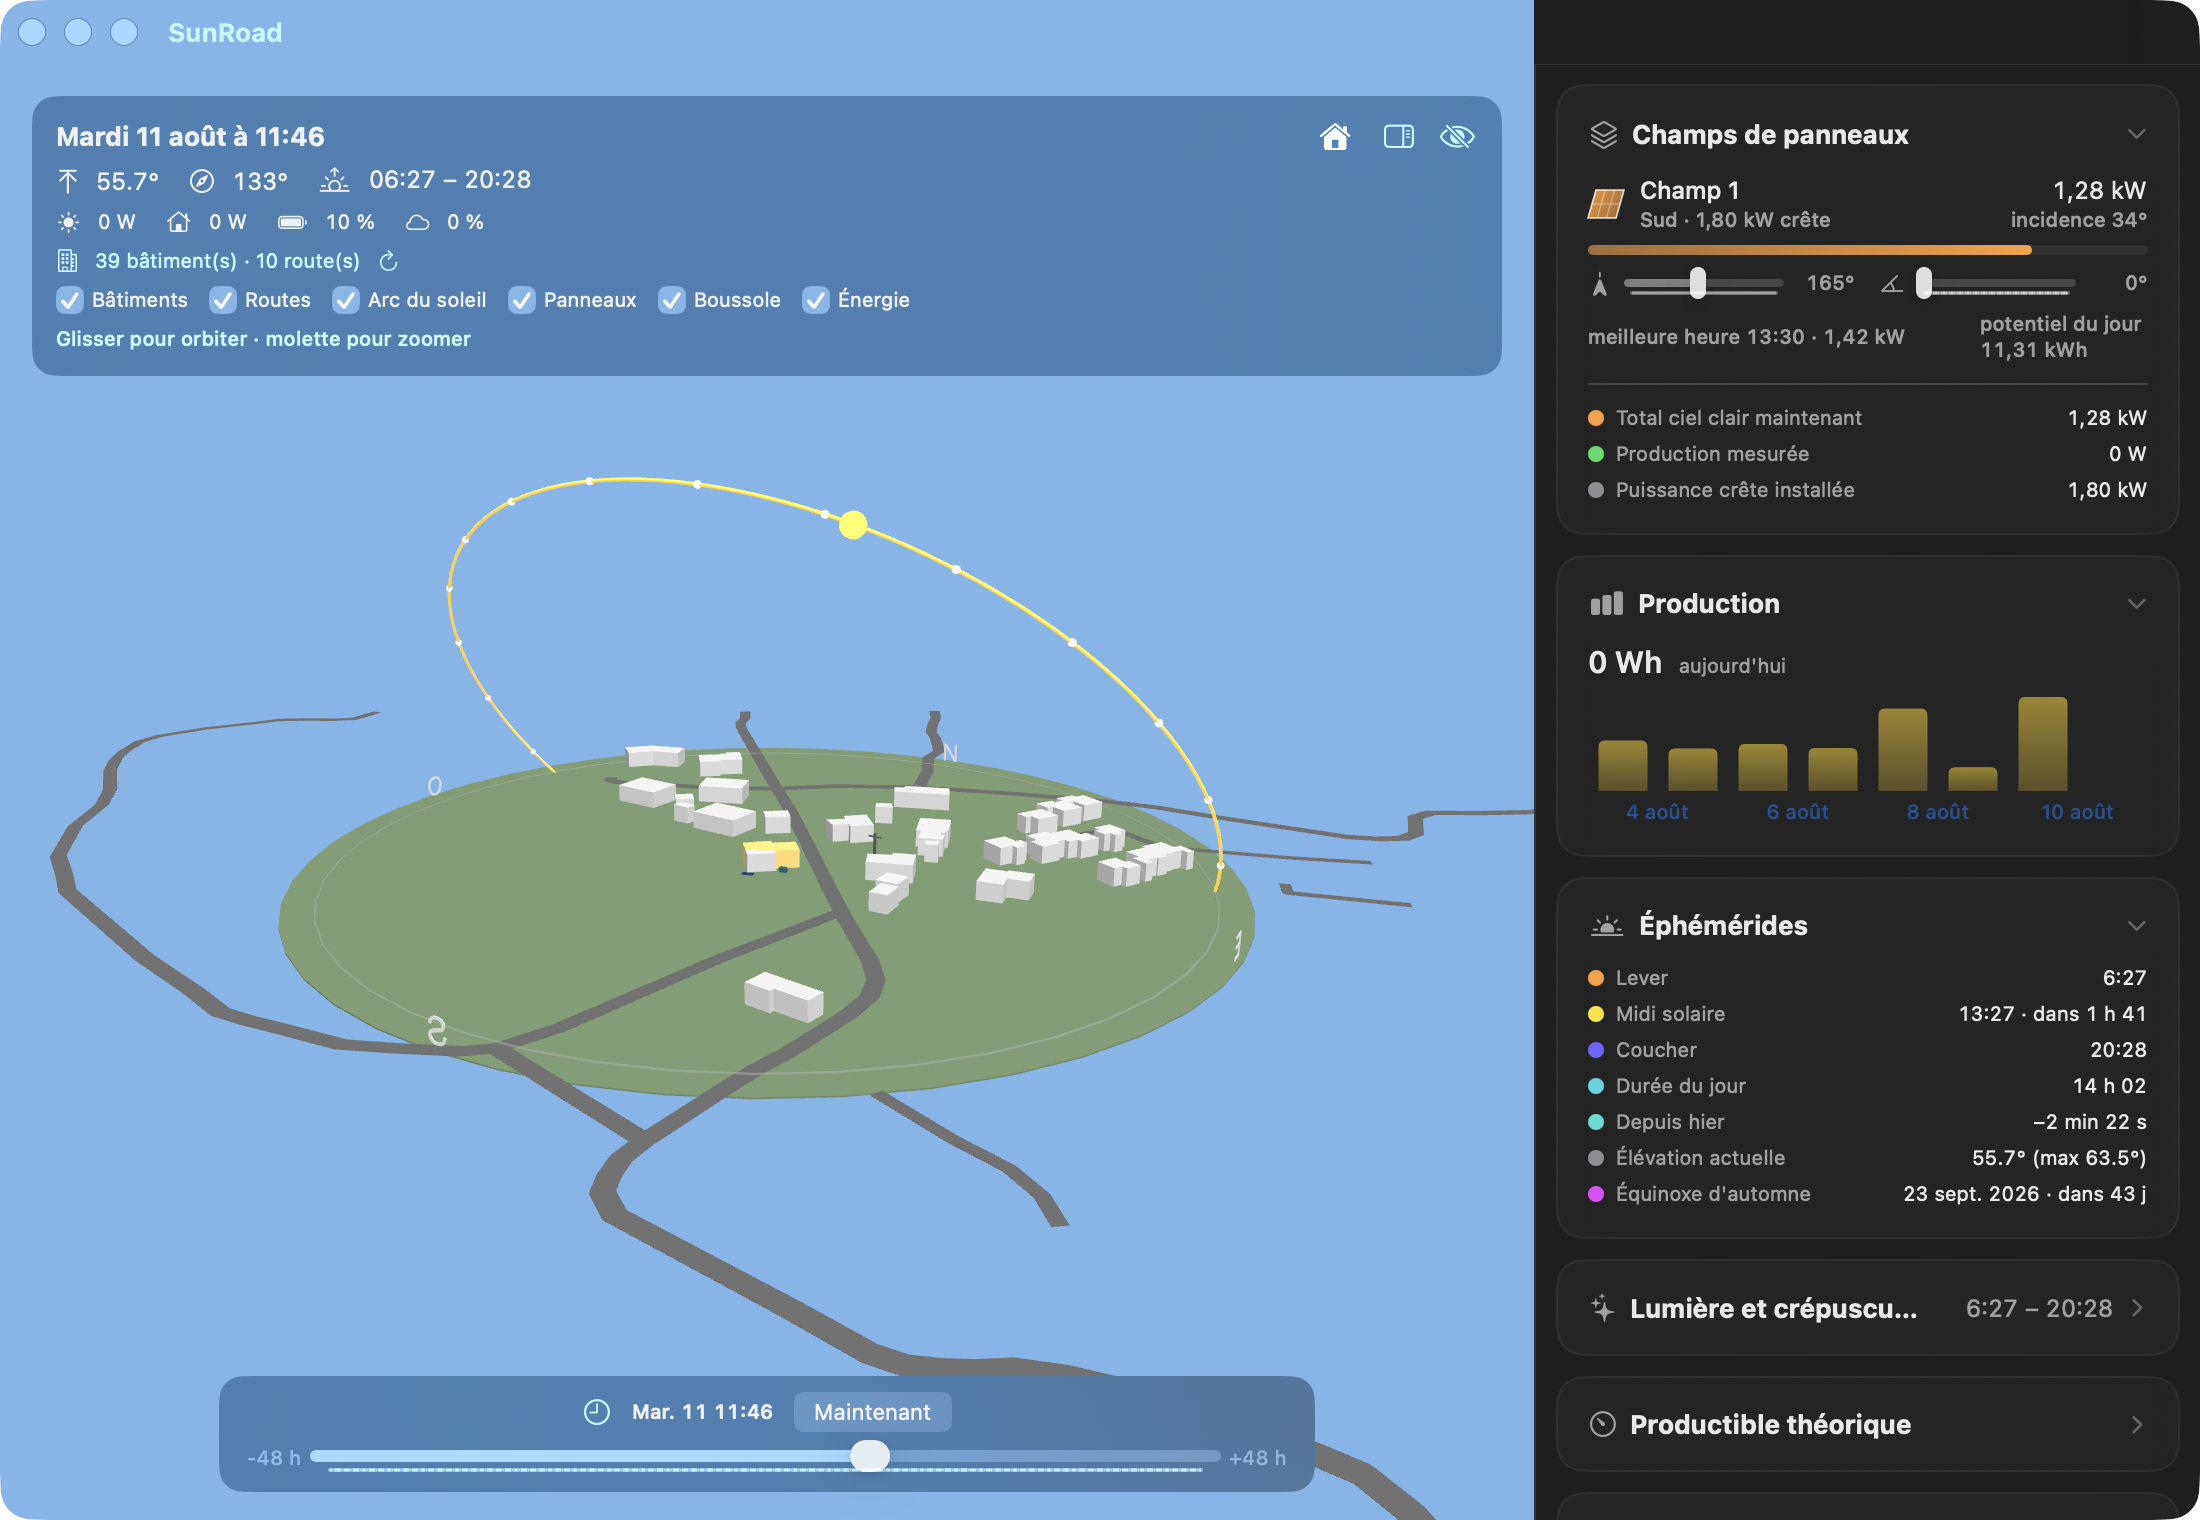
New in 2.0. A real-3D scene of your house, your neighborhood and the sun: building footprints and roads from OpenStreetMap, the sun as an actual light source with real cast shadows sweeping across the day, your panel arrays at their true azimuth and tilt, animated energy-flow beads paced by the live watts, a production ribbon along the sun's arc, real cloud cover veiling the light, a ±48 h timeline, per-layer visibility toggles and a clean wall mode. Inspired by the Helios card for Home Assistant — in native SceneKit.

📈 History window

New in 1.12. Daily energy fetched from Zendure's servers — up to 365 days back, even for periods when your Mac was off. Bar charts over 7/30/90/365 days per device, per-device metric lists (solar, home, battery charge/discharge…), lifetime totals, and a local cache so past days are only downloaded once. Signs in with your main Zendure account, stored only in the Keychain — works in local and cloud modes alike.

🧩 macOS widgets

Three sizes for the desktop and Notification Center: small and medium with the live production, and — new in 1.7 — a large widget carrying the full 14-day production histogram, so the trend stays visible even with the panel closed.

🎛️ Battery control

A dedicated tab to change the AC mode and the output and charge limits of the battery, written straight to the device over the local API.

📄 CSV export

Export the recorded production history to CSV and take it to a spreadsheet — daily kWh, multi-day trends, whatever you feel like plotting yourself.

🔔 Smart notifications

Optional alerts: battery low or full, unexpected grid draw while the sun is shining, and daily production records. Plus launch at login, a theme override, an upfront permissions check, and a UI localized in French and English.

The dashboard — and SunRoad in 3D

A dedicated window for the whole picture — with the energy flow readable as a schematic or as a Sankey since 2.2 — and, since 2.0, a real-3D scene of your home under its sun (SunRoad replaces the former Sun window; its analytics live on in the sidebar).

Zendure Monitor SunRoad window: a real-3D scene with the OpenStreetMap neighborhood (buildings and roads), the user's house highlighted in amber, the sun's arc with hourly markers, the compass ring, a ±48 h timeline at the bottom, and a sidebar with the panel-array orientation sliders, the 14-day production histogram and the ephemerides
SunRoad — your neighborhood from OpenStreetMap, your house in amber, the sun's real arc with its hourly markers, the ±48 h timeline, and the sidebar carrying the orientation sliders, production histogram and ephemerides.
Zendure Monitor dashboard: the Schéma / Sankey picker above a hub-centric energy-flow diagram with the SolarFlow at the center and panels, batteries, public grid, home and off-grid outlet as peripherals, plus production, battery, device and history cards
The dashboard in its Schematic reading: links animate only when energy actually flows, with live wattage — and with a Smart CT, the real grid draw and the home's total consumption.
The same energy-flow card read as a Sankey diagram: the public grid feeds the home through a wide band passing above the SolarFlow, while the solar production flows through the SolarFlow to the home, each ribbon's width proportional to its wattage
The same moment and the same numbers as a Sankey: ribbon width is the wattage. Here the grid (1.19 kW) feeds the house through a band that bypasses the SolarFlow entirely, while the solar production (435 W) flows through it — a proportion the schematic, with its constant-width links, cannot show.

Three connection paths — your choice

Local-first by design, but never stuck: the app can reach your battery three different ways, and the bottom of the panel always tells you which one is in use, with a green/orange status dot.

🏠 Local — primary host

The default and the recommendation. Recent Zendure firmwares embed a plain HTTP server on the device itself — the zenSDK REST API. One GET /properties/report on your LAN every few seconds, found over Bonjour or by IP. No account, no broker, no credentials, nothing leaves your network.

🔒 Local — fallback host (VPN)

Away from home? Set a second address — the same battery reached through a Tailscale or WireGuard tunnel. The app polls the primary host first and switches over automatically when it doesn't answer, then keeps checking the primary to switch back. Same local API, same data, still nothing shared with anyone.

☁️ Zendure Cloud

New in 1.10, and optional. When the local API isn't reachable at all, switch the data source to Zendure's servers: paste the mobile app's Authorization Cloud Key (kept in the macOS Keychain) and the reports arrive in real time over MQTT, from anywhere — no VPN. Read-only by design: battery control stays local-only. Since 1.11 the switch can even be automatic, both ways.

⚠️ A word on remote access: the zenSDK API has no authentication whatsoever. Never port-forward the device's port 80 to the internet — use a VPN into your home network and point the fallback host at that, or use the Cloud mode. The README walks through the Tailscale setup.

Supported hardware

Developed and tested on a SolarFlow 2400 Pro. Any Zendure device that ships the local zenSDK REST API should work:

SolarFlow 2400 Pro SolarFlow 2400 AC SolarFlow 2400 AC+ SolarFlow 2400 AC Pro SolarFlow 800 Pro SolarFlow 800 Plus SolarFlow 1600 AC+ SolarFlow 3000 Mix AC+ SolarFlow 4000 Mix

If discovery finds nothing, the local API may simply be disabled on your unit — adding a HEMS integration in the Zendure mobile app and then quitting it is the documented way to turn it on for good.

Install

Download the DMG from the latest release — signed and notarized, so it opens without a Gatekeeper detour.

Drag ZendureMonitor.app to /Applications and launch it. It lives in the menu bar, not in the Dock.

Accept the local network prompt — macOS asks for it, and the app needs it to reach the battery on your LAN.

Point it at your device. Click the ☀️ icon → Settings → scan the network (or type the IP address) → test the connection. Done.

Updates land in-app afterwards through Sparkle — no need to come back here.

Need more? The full user guide covers every window, the widgets, battery control, remote access and troubleshooting — in French or English, also on the wiki.

Light appearance too

The panel follows the system appearance — and you can pin it to dark or light if you'd rather it didn't follow along.

The same Zendure Monitor panel rendered in the macOS light theme
The same panel, with the system set to light.